Web development is a dynamic field that constantly challenges developers with a myriad of potential issues. Whether you’re a seasoned pro or a budding coder, encountering web development errors can be both frustrating and time-consuming. However, understanding these errors and having a structured approach to troubleshooting can significantly reduce the headache. This guide will delve into common web development errors, providing you with proven troubleshooting tips that can save you time and enhance your skills.
📌 Key Takeaways
Identify and resolve common web development errors effectively.
Learn step-by-step troubleshooting techniques for HTML, CSS, and JavaScript.
Save time and reduce frustration with practical debugging strategies.
📋 Table of Contents
16 Sections
id=”understanding-common-web-development-errors” class=”autoblogger-h2″ style=”font-size: 1.75rem; font-weight: 800; color: #0f172a; margin: 2.5rem 0 1.25rem 0; border-bottom: 2px solid #e2e8f0; padding-bottom: 0.5rem;”>Understanding Common Web Development Errors
Web development spans a wide range of technologies and languages, each with its unique set of challenges. The most common culprits of web development errors usually involve HTML, CSS, and JavaScript. Recognizing these typical errors can help you diagnose and resolve issues more efficiently.
HTML Errors
HTML serves as the backbone of web pages, and even minor errors can lead to significant display problems. Common HTML errors include missing closing tags, incorrect nesting, and invalid attributes. These issues can cause elements to display incorrectly or not at all, affecting the user experience and the functionality of the site.
CSS Issues
CSS is crucial for styling web pages, and errors here often lead to visual inconsistencies. Common issues include specificity conflicts, where styles don’t apply as expected, and problems with responsive design, where layouts break on different devices. These issues can make a site look unprofessional and difficult to navigate.
JavaScript Bugs
JavaScript adds interactivity to web pages, but it also introduces complexity. Syntax errors, such as missing semicolons or mismatched brackets, and runtime errors, which occur during code execution, are common. These bugs can halt scripts, leading to broken functionality and poor user experience.
Troubleshooting HTML Errors
HTML errors are often the easiest to spot but can be tricky to resolve without a systematic approach. Here’s how to tackle them:
Invalid Tags and Attributes
Validate Your HTML: Use [tools](https://wilson.com.np/tools/) like the [W3C Validator](https://validator.w3.org) to check for errors in your HTML code. These tools can identify invalid tags and attributes, guiding you toward a fix.
Review Documentation: Cross-reference your code with [W3C Standards](https://www.w3.org) to ensure you’re using elements correctly.
Check for Typos: Scan your code for simple typos, such as missing or misplaced tags, which can easily cause errors.
Structural Mistakes
Ensure Proper Nesting: Elements should be properly nested within their parent elements. Incorrect nesting can disrupt page structure.
Close Every Tag: Make sure all tags are closed properly. An unclosed tag can lead to rendering issues.
💡 Pro Tip: Use an HTML editor with syntax highlighting to help spot errors quickly and improve code structure.
Resolving CSS Issues
Resolving CSS Issues
CSS can be tricky, especially when dealing with complex stylesheets. Here’s how to resolve common issues:
Styling Conflicts
Use Browser Developer Tools: Inspect elements using developer tools (like Chrome DevTools) to see which styles are applied and override conflicts.
Review Specificity: Ensure your styles are specific enough to apply as intended. Use more specific selectors if necessary to overcome conflicts.
Responsive Design Problems
Check Media Queries: Ensure your media queries are set up correctly to handle different screen sizes.
Test Across Devices: Use tools like BrowserStack to simulate different devices and screen sizes for testing.
⚠️ Important Note: Always test your website on multiple browsers to ensure consistent styling across platforms.
Debugging JavaScript Bugs
Debugging JavaScript Bugs
JavaScript errors can be particularly challenging, but a systematic approach can help:
Syntax Errors
Use a Linter: Tools like ESLint can help identify syntax errors before they become a problem.
Review Error Messages: JavaScript consoles provide error messages that can guide you to the exact line of code causing the issue.
Runtime Errors
Utilize Debugging Tools: Use tools like the [Mozilla Developer Network’s](https://developer.mozilla.org) resources to understand and resolve runtime errors.
Implement Breakpoints: Set breakpoints in your code to pause execution and inspect variable states and logic flow.
Check for Undefined Variables: Ensure all variables are defined and initialized properly to avoid runtime issues.
Best Practices for Web Development Troubleshooting
Adopting best practices can prevent many web development errors before they arise:
Using Developer Tools
Familiarize Yourself: Learn to use browser developer tools effectively. They can help you inspect elements, debug JavaScript, and monitor network requests.
Console Logging: Use `console.log()` strategically to track variable values and application flow during development.
Implementing Testing Frameworks
Automate Testing: Use testing frameworks like Jest for JavaScript to automate and streamline your testing process.
Continuous Integration: Implement continuous integration tools to ensure your code is tested regularly, catching errors early.
By understanding and addressing common web development errors with these troubleshooting tips, you can enhance your efficiency and reduce frustration. Remember, every error is an opportunity to learn and improve your coding skills. Happy coding!
For further reading and reference, the [Mozilla Developer Network](https://developer.mozilla.org) and [W3C Standards](https://www.w3.org) offer comprehensive resources on best practices and error handling in web development.
Frequently Asked Questions
What are the most common web development errors?
Common errors include HTML tag mistakes, CSS styling conflicts, and JavaScript bugs.
How can I fix JavaScript runtime errors?
Use browser developer tools to identify and resolve runtime errors efficiently.
Why is responsive design important in web development?
Responsive design ensures websites function well on all devices, improving user experience.
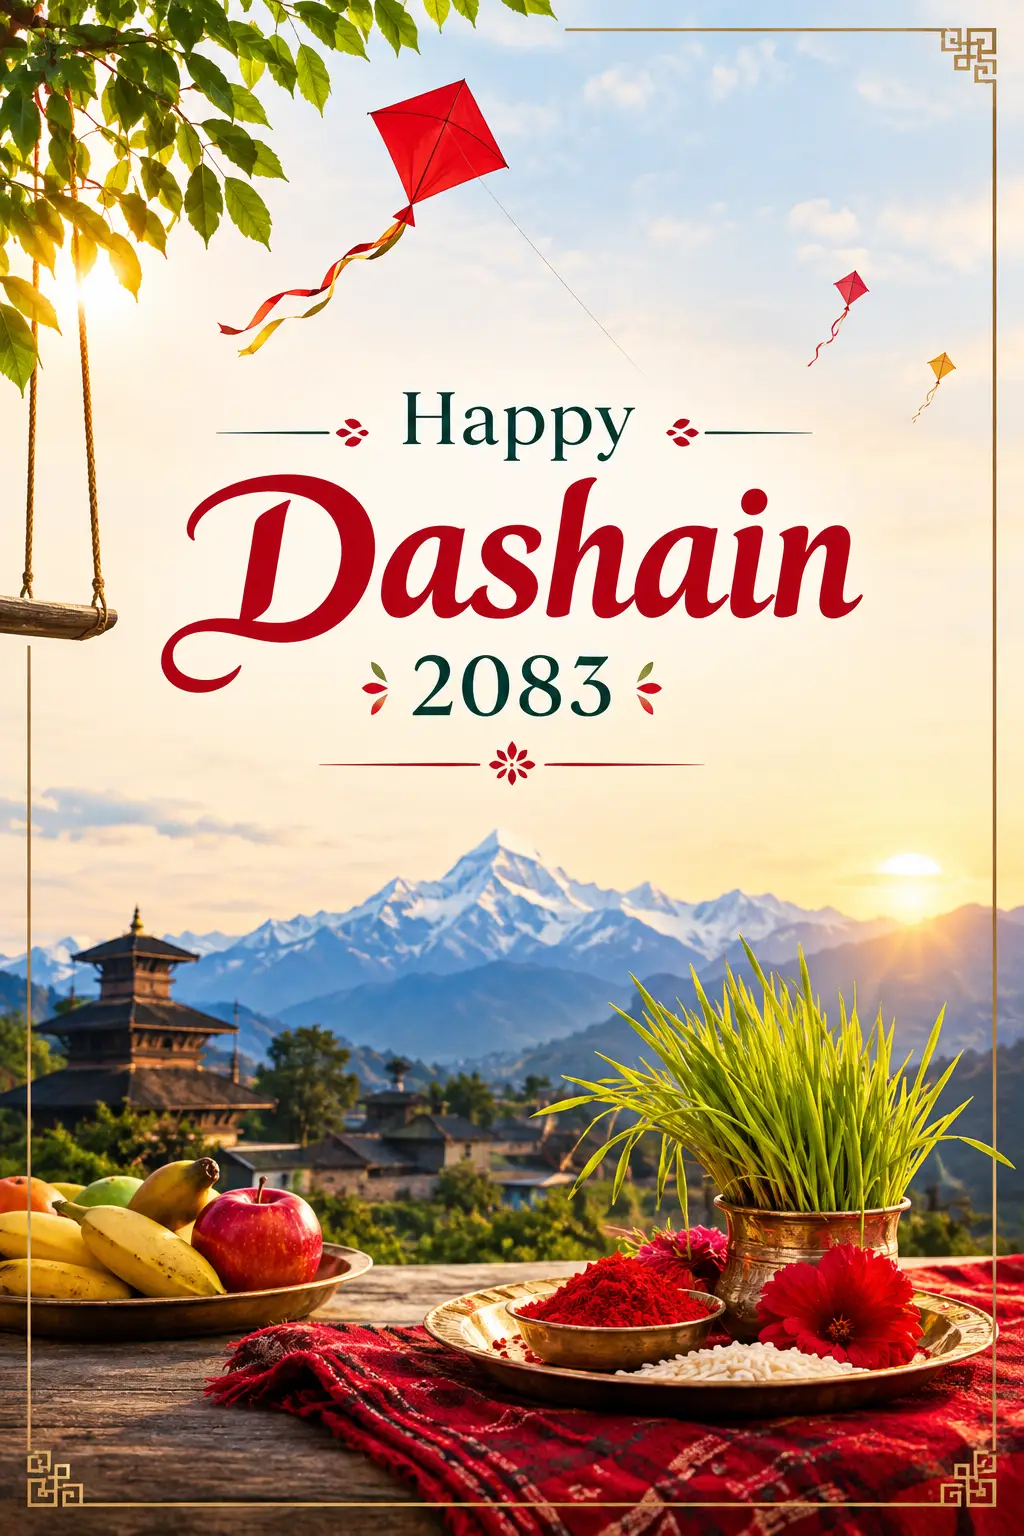
Six original Dashain greeting card designs for 2083 BS, drawn by hand in Kathmandu and released free for personal and commercial use. One click per card — no signup, no watermark, no “premium” upsell.
Quick answer: scroll to the card gallery and hit the red download button under any design. Each file is a high-resolution WebP you can post straight to Facebook, Instagram, Viber or WhatsApp, or hand to a local press for printing.
Cost: free — personal and commercial use (shops, schools, consultancies, offices)
Attribution: not required (a credit link is always appreciated, never demanded)
Included: print-size cards, social-media-size posts, and Nepali शुभकामना text you can copy
Dashain 2083: Ghatasthapana 11 October 2026 · Vijaya Dashami (Tika) 21 October 2026
Nobody in the top results tells you what size to export for a Nepali print shop, nobody pairs the cards with the actual 2083 dates, and nobody gives you the Nepali text to write on them. This page fixes all three. If you also want my older catalogue of festival artwork, the Dashain greeting card, banner and post design collection has more of my Durga illustrations, and there is a matching set for the next festival in the Tihar greeting card and banner design post.
Dashain 2083 key dates (so your card goes out on time)
A greeting card posted two days late gets scrolled past. Here is the calendar for Bikram Sambat 2083, so you know when to schedule your post or send the print job.
Day
Nepali date (2083 BS)
English date
What to post
Ghatasthapana (Day 1)
Ashwin 25
Sunday, 11 Oct 2026
Festival-opening card, jamara imagery
Phulpati (Day 7)
Ashoj 31
Saturday, 17 Oct 2026
Travel/homecoming themed post
Maha Ashtami (Day 8)
Kartik 1
Sunday, 18 Oct 2026
Durga Bhawani artwork
Maha Navami (Day 9)
Kartik 3
Tuesday, 20 Oct 2026
Business/office closure notice
Vijaya Dashami / Tika
Kartik 4
Wednesday, 21 Oct 2026
Main greeting card — peak sharing day
Kojagrat Purnima (Day 15)
Kartik 8
Sunday, 25 Oct 2026
Closing / thank-you post
The auspicious tika time for Vijaya Dashami 2083 is fixed by the Nepal Panchanga Nirnayak Samiti and is announced shortly before the day — check a Nepali patro for the exact sait. Practical scheduling tip from running client accounts for several Dashains: publish your main card the evening before Tika, around 7–9 PM, when everyone is already home and on their phones. Morning-of posts get buried under the flood.
Every card below is my own artwork. I hold full rights and I am releasing them free for both personal and commercial use — put your shop's logo on them, print them, send them to clients. The only thing I ask is that you do not resell the files themselves as stock.
In a hurry? Grab the whole set at once — six files, roughly a few seconds.
1. Dashain 2083 card — print paper size
Print ready
Portrait
WebP
Laid out at standard greeting-card proportions with a safe margin around the text, so a press can trim it without eating your wording. This is the one to hand over at the print shop.
The more traditional of the two print layouts — heavier red and gold, Durga Bhawani as the focal point. This is what most Nepali families and older clients expect a Dashain card to look like.
A lighter, brighter take with the full spread of Dashain motifs — kites, swing (ping), jamara and tika. Works equally well printed or posted, and it reads clearly at small thumbnail size.
4. “Bada Dashain ko Shuvakamana” — Nepali text card
Nepali script
Formal
WebP
Full Nepali wording already typeset on the artwork, so you do not need a Nepali font installed to send a proper greeting. The most-used card of the set among offices and consultancies.
Deliberately left with clear space in the lower third. If you are a shop or school, this is the one to drop your logo and phone number into without covering any artwork.
Cropped for the feed rather than for paper. Nothing important sits near the edges, so Facebook's preview crop and Instagram's grid thumbnail will not slice off your message.
This is the part every other result skips, and it is the part that costs people money. I have had cards come back from a press in New Road with the bottom line of text guillotined off, purely because the file was exported at trim size with no bleed. Use this table instead.
Format
Trim size
Export at 300 DPI
Best for
A6 (most common card)
105 × 148 mm
1240 × 1748 px
Hand-out cards, desk cards
A6 + 3 mm bleed
111 × 154 mm
1311 × 1819 px
Full-colour edge-to-edge printing
A5 (folded or flat)
148 × 210 mm
1748 × 2480 px
Corporate cards, longer messages
5 × 7 inch
127 × 178 mm
1500 × 2100 px
Photo-lab printing
Social square
—
1080 × 1080 px
Facebook & Instagram feed
Story / status
—
1080 × 1920 px
Instagram & WhatsApp status, Viber
Three rules that will save you a reprint:
Add 3 mm bleed on every edge. Backgrounds must run past the cut line or you get a thin white sliver down one side.
Keep text 5 mm inside the trim. Guillotines drift, especially on long runs. Anything closer to the edge is gambling.
Convert to CMYK before printing. The deep Dashain red on your screen is RGB. In CMYK it shifts duller — better to see that on your monitor than on 500 printed cards.
For paper, 250–300 GSM art card is the sweet spot in Nepal: stiff enough to stand on a desk, cheap enough for bulk. Matte lamination hides fingerprints better than gloss, which matters when a card is passed around a whole family at Tika.
Nepali Dashain wishes you can copy and paste
If you want to write your own message alongside the card, here are the standard formal and warm phrasings in Unicode Nepali — tap Copy and paste straight into Facebook, Viber or WhatsApp.
विजया दशमीको हार्दिक मंगलमय शुभकामना !
बडा दशैंको हार्दिक शुभकामना तथा सुखद भविष्यको शुभेच्छा !
यस पावन दशैंले तपाईंको जीवनमा सुख, शान्ति र समृद्धि ल्याओस् !
Wishing you and your family a joyous Bada Dashain 2083 !
One small thing I learned the hard way: if you type in Preeti font and paste it online, most people will see gibberish. Always convert Preeti to Unicode before posting to social media — printed material is the only place Preeti still belongs.
How to use these cards (step by step)
Pick your use case first. Printing? Take the two card-paper-size files. Posting? Take the social media file.
Click the download button under that card. The file saves directly to your device — on mobile it lands in Downloads or your gallery.
Add your branding if you are a business. Canva, Photopea or even PowerPoint will do it: drop your logo into the clear lower third of card 5.
Convert for print if you are going to a press — resize to the table above, set CMYK, add 3 mm bleed, export as PDF.
Schedule your post for the evening before Tika, 21 October 2026, and pair it with one of the Nepali wishes above.
Frequently asked questions
Are these Dashain greeting cards really free for commercial use?
Yes. I designed them and I hold the rights. You can use them for a business page, a printed shop card, a school notice or a client greeting at no cost. The only restriction is that you may not redistribute or resell the files themselves as stock artwork.
What size should a Dashain greeting card be for printing?
A6 (105 × 148 mm) is the standard and most economical choice, exported at 1240 × 1748 px for 300 DPI, or 1311 × 1819 px once you add a 3 mm bleed. A5 works when you need room for a longer corporate message.
When is Dashain 2083 Tika?
Vijaya Dashami, the main Tika day of Dashain 2083, falls on Wednesday 21 October 2026 (Kartik 4, 2083 BS). The festival opens with Ghatasthapana on 11 October 2026 and closes with Kojagrat Purnima on 25 October 2026.
Why are the files in WebP format?
WebP keeps the artwork sharp at a fraction of the file size, so the page loads fast on mobile data. Every modern phone, browser, Canva and Photoshop opens WebP. If your print shop insists on JPG or PNG, any free online converter handles it in one step — or message me and I will send the original.
Can I add my company logo and phone number to these cards?
Absolutely, and card 5 was laid out specifically for that — the lower third is intentionally kept clear so your branding does not cover any illustration.
I have been designing festival graphics in Kathmandu for over five years — for schools, education consultancies, bike showrooms and small shops. Every Dashain the same thing happens: a client messages on Ashwin 20 asking for a card by tomorrow, and ends up pulling a watermarked Dussehra template off a stock site because there is nothing Nepali and free available at short notice.
That is the whole reason this page exists. The cards are the ones I actually drew for real clients, cleaned up and released. If you need something customised — your brand colours, your logo, a specific size for a hoarding board — that is what I do for a living, and you can reach me through the site.
If any of these helped you, the kindest thing you can do is share the page rather than just the image, so the next person searching at 11 PM on the night before Tika finds it too. शुभ दशैं !
Wilson Shrestha — Graphic Designer & Web Developer, Kathmandu
Five-plus years designing print and social media graphics for Nepali businesses, and the developer behind wilson.com.np. All artwork on this page is original work, released free to the Nepali community for Dashain 2083.
SIP Calculator Nepal — work out exactly what your monthly mutual fund SIP will be worth, in Nepali rupees, with step-up, inflation and tax built in. Most SIP calculators in Nepal give you one number and stop. This one shows you the number, the year-by-year path, what that money is actually worth after inflation, and how much you need to invest to hit a specific goal.
SIP Calculator — Nepal (NPR)
Updated Sept 2026
We'll tell you the monthly SIP required to reach it.
Existing units or a Dashain bonus you invest on day one.
Minimum SIP in Nepal is usually Rs 1,000 (100 units at Rs 10 par).
Nepali SIP schemes accept all four cycles.
Nepali bank FDs sit near 3–5.8%. Equity mutual funds vary and carry real risk.
SIP rewards time far more than it rewards timing.
Advanced: step-up, inflation, tax & fund expenses
Salary goes up ~10% a year? Let your SIP go up with it.
Nepal's headline inflation has been running near 3.25%; 5% is a safer long-run planning number.
Deducted from your return. Check the scheme's offer document.
Open-ended schemes often charge this if you redeem early.
Value after 15 years
Rs 25.2 lakh
Rs 25,22,880
Total invested
Rs 9 lakh
Rs 9,00,000
Returns earned
+Rs 16.2 lakh
Rs 16,22,880
Real value (today's money)—
Gain multiple—
Effective net return—
Final-year growth—
Amount investedReturns earnedReal (inflation-adjusted) value
How this is calculated: instalments are compounded at the start of each period (annuity-due), the same convention Nepali fund managers use in their own return tables — so the numbers here reconcile with the Nabil, NIMB and Siddhartha calculators when you use the same inputs. This is an illustration, not a forecast. Mutual funds have no fixed rate of return and unit values move with NEPSE.
What a SIP Calculator Actually Does (and What It Can't Do)
A Systematic Investment Plan is a standing commitment: you put a fixed amount into an open-ended mutual fund on a fixed schedule, and the fund manager buys units for you at that day's NAV. A SIP calculator is the arithmetic that turns "Rs 5,000 a month" into "roughly this much in fifteen years."
Here's the part most Nepali calculator pages skip. A SIP calculator does not predict returns. It answers a conditional question: if the fund averages X% a year, here is what compounding produces. The "if" is doing all the work. NAV moves with NEPSE, dividends are declared annually and vary, and nothing about mutual fund performance is contractual. Every serious fund manager in Nepal attaches the same warning to their tool, and it's worth reading rather than scrolling past.
What the calculator is genuinely good for:
Sizing the commitment. You find out fast whether Rs 2,000 a month can realistically fund a Rs 50 lakh goal, or whether you need Rs 12,000.
Seeing the shape of compounding. The year-by-year table above is the real lesson: years 1–7 look boring, years 12–20 do almost all the heavy lifting.
Comparing trade-offs. Five more years versus a 2% higher return versus a 10% annual step-up — the calculator tells you which lever actually matters. (Spoiler: it's usually time, then step-up, then return.)
Reality-checking a sales pitch. If somebody shows you a projection, plug the same inputs in here. If the numbers don't match, ask why.
How to Use This SIP Calculator Nepal — Step by Step
Pick a mode. Four tabs: SIP Return (I invest X, what do I get?), Goal Planner (I want Rs Y, what must I invest?), Lumpsum + SIP (I already hold units and I'm adding monthly), and Withdrawal (SWP) (I've built a corpus, how long will it last?).
Enter your instalment. Type it or drag the slider. The minimum practical SIP in Nepal is Rs 1,000, because the minimum purchase is 100 units at Rs 10 par value.
Choose the cycle. Monthly, quarterly, semi-annual or annual. Nepali schemes support all four, and the calculator compounds accordingly — a quarterly SIP of Rs 3,000 is not the same as Rs 1,000 monthly.
Set an expected return. Be honest here. See the rate section below before you slide it to 20%.
Set the duration. Drag it to 20 years, then back to 10, and watch the returns column. That gap is the entire argument for starting early.
Open "Advanced." This is where this tool leaves the bank calculators behind: annual step-up, inflation adjustment, fund expense drag, exit load, and the 5% short-term capital gains toggle.
Read the fourth number. Most calculators show three boxes. The strip underneath gives you real (inflation-adjusted) value, gain multiple, effective net return and final-year growth. Real value is the number that tells you what your corpus will actually buy.
Try this right now. Set Rs 5,000/month, 12% return, 20 years, and 0% step-up. Note the figure. Now set step-up to 10% and leave everything else alone. The difference is what a single habit — raising your SIP when your salary rises — is worth over a working lifetime. No other input you can change produces a jump that size.
SIP Return Calculator: The Formula Behind the Numbers
Nepali fund houses publish the same standard future-value-of-an-annuity formula, and this calculator implements it identically so your numbers reconcile:
FV = P × [ ((1 + i)n − 1) ÷ i ] × (1 + i)
FV — future value, what you end up with
P — your instalment amount each period
i — periodic rate: annual return ÷ 100 ÷ number of periods per year
n — total number of instalments (years × periods per year)
A worked example you can verify
Rs 5,000 monthly, 15% expected annual return, 10 years.
Total invested: Rs 6,00,000 · Total gain: Rs 7,93,286
Run those exact inputs through the calculator above and you'll land on the same figure — and on the same figure Siddhartha Capital's calculator produces. That's deliberate. A calculator that disagrees with the fund manager's own tool is a calculator nobody can trust.
The detail that trips up half the SIP calculators online
Notice the trailing × (1 + i). That term exists because a SIP instalment is paid at the start of the period, not the end — your Shrawan payment earns a full month of growth before the Bhadra payment arrives. In finance this is an annuity-due; the version without that term is an ordinary annuity.
Over 20 years at 12%, the difference between the two conventions is roughly 1% of your final corpus. On a Rs 50 lakh outcome that's Rs 50,000 — not fatal, but enough that two calculators showing different numbers for identical inputs will make you doubt both. This one uses annuity-due, period by period, which is why the year-by-year table reconciles exactly with the annual-mode tables published by Nabil Invest and NIMB Ace Capital.
SIP Goal Calculator: Work Backwards From What You Actually Want
Most people don't start with "I have Rs 5,000 spare." They start with "I need Rs 40 lakh for a flat in Bhaktapur in twelve years" or "my daughter starts an engineering degree in 2038." Forward-only calculators make you guess an instalment, look at the result, adjust, and repeat.
The SIP Goal Calculator tab inverts it. Enter the target and the horizon; it solves for the instalment. Internally it runs a binary search across the same period-by-period engine, so step-up and expense drag are respected — an algebraic rearrangement of the formula can't handle a rising contribution, which is exactly why most goal calculators quietly disable step-up.
Realistic Nepali goals and what they cost
At a 12% assumed annual return, no step-up:
Goal
Target
Horizon
Monthly SIP needed
You actually pay in
Emergency buffer
Rs 5,00,000
5 years
≈ Rs 6,100
Rs 3,66,000
Child's higher education
Rs 25,00,000
15 years
≈ Rs 5,000
Rs 9,00,000
Land / flat down payment
Rs 40,00,000
12 years
≈ Rs 12,500
Rs 18,00,000
Retirement corpus
Rs 1,00,00,000
25 years
≈ Rs 5,300
Rs 15,90,000
Look at the last two rows together. A Rs 1 crore retirement goal over 25 years costs less per month than a Rs 40 lakh goal over 12 years. That isn't a typo — it's compounding, and it is the single strongest argument for starting a SIP in your twenties rather than your thirties. If you're thinking about where a SIP fits alongside other options, our overview of investment opportunities in Nepal puts the choices side by side.
Step-Up SIP: The Feature Almost No Nepali Calculator Has
A step-up SIP (also called a top-up SIP) raises your instalment by a set percentage every year. If your salary rises roughly 10% annually — which is not an unusual trajectory in Kathmandu's private sector — a flat Rs 5,000 SIP becomes a progressively smaller share of your income each year. Step-up keeps the commitment proportional.
Here's the arithmetic over 20 years at 12%, starting from Rs 5,000 a month:
Annual step-up
Total invested
Final corpus
Gain multiple
0% (flat SIP)
Rs 12,00,000
≈ Rs 49.96 lakh
4.2×
5% per year
Rs 19,83,957
≈ Rs 68.69 lakh
3.5×
10% per year
Rs 34,36,500
≈ Rs 99.44 lakh
2.9×
15% per year
Rs 61,46,615
≈ Rs 1.51 crore
2.5×
Two honest observations about that table, which promotional content tends to omit:
Step-up roughly doubles the outcome — Rs 49.96 lakh to Rs 99.44 lakh at a 10% step-up. That is a genuinely large effect.
The gain multiple falls. 4.2× down to 2.9×. Money you contribute in year 18 only compounds for two years, so later rupees work less hard. Step-up wins because you invest more, not because it's magically more efficient. Anyone selling it as free money is misleading you.
Practically: Nepali fund portals don't currently automate a step-up. You raise it manually — either by editing your SIP registration or registering a second small SIP alongside the first. Put a calendar reminder for the month after your annual appraisal. That single recurring task is worth more than any fund-picking you will ever do.
What Return Rate Should You Actually Enter? A Nepal Reality Check
This is the question every SIP calculator makes you answer and none of them help with. The default is usually 12%, inherited from Indian calculators, and it gets treated as a promise.
Let's anchor it to Nepali numbers instead.
The risk-free floor
Fixed deposit rates at most Nepali commercial banks currently run roughly 2.8% to 5.8% per annum for individual customers, with short-term FDs of three to six months around 2.8–3.3%, one-to-two-year deposits near 3.5–4.5%, and longer five-year-plus deposits reaching 5.8% or more at some banks. The system-wide average deposit rate sits at about 3.51%, against average lending of 7.00%, with the NRB policy repo at 4.25% and the bank rate at 5.75%.
So a genuinely safe, government-supervised return in Nepal today is roughly 3–5%. Anything above that is compensation for accepting risk.
The inflation hurdle
Nepal's inflation has been running near 3.25% alongside GDP growth of about 3.99%. That means a 3.5% FD is barely breaking even in real terms. This is precisely why the calculator above has an inflation field — and why you should look at the "Real value" figure, not just the headline corpus.
The equity reality
NEPSE has traded around the 2,950 level with a market capitalisation near NPR 4.43 trillion. Nepali equity mutual funds draw their returns from this market, which means two things: the long-run upside is meaningfully higher than an FD, and the ride is genuinely volatile. NEPSE has delivered multi-year stretches of both spectacular gains and grinding declines.
Current NAVs across the open-ended SIP schemes sit close to par. As of mid-September 2026: NIBL Sahabhagita Fund at 9.95, Siddhartha's SSIS at 10.79 and SEF at 10.35, and Nabil's NFCF at 10.26 with NI 31 at 10.39. Dividends are separate: Nabil Flexi Cap Fund paid a 5% cash dividend in FY 2080/81 and 9% in FY 2081/82, while NIBL Sahabhagita's dividend history shows 8.25% in FY 2076/77, 50% in FY 2077/78, 7.2% in FY 2078/79 and 4% in FY 2079/80.
Read that NIBL sequence carefully, because it is the most useful row of data on this page. A 50% year followed by a 4% year is what "average returns" actually looks like from the inside. No SIP calculator on earth can produce that path — it can only average it.
My recommended way to use the return slider
Don't pick one number. Run three scenarios and plan against the middle one.
Pessimistic — 6%. Roughly an FD plus a small equity premium. If your goal still works here, your plan is robust.
Base case — 10%. A defensible long-run assumption for a diversified Nepali equity or balanced fund. Plan with this.
Optimistic — 15%. Possible in a strong NEPSE cycle. Treat anything above this as fantasy, not planning.
If a goal only works at 18%, it isn't a plan — it's a bet. Extend the horizon or raise the instalment instead.
Open-Ended SIP Schemes in Nepal (2026): Who Runs What
Before the calculator means anything, you need somewhere to actually put the money. SIP in Nepal runs through open-ended mutual funds operated by bank-affiliated capital companies. The main pairings are: Nabil Investment Banking (Nabil Bank) running NI 31 and Nabil Flexi Cap Fund; NIMB Ace Capital (Nepal Investment Mega Bank) running NIBL Sahabhagita Fund; NMB Capital (NMB Bank) running NMB Saral Bachat Fund–E; and NIC Asia Capital (NIC Asia Bank) running NIC Asia Dynamic Debt Fund and NIC Asia ELIS. Siddhartha Capital runs SSIS, and Laxmi Capital runs Subha Laxmi Kosh.
Fund manager
Bank
SIP scheme(s)
Type
Nabil Investment Banking
Nabil Bank
NI 31, Nabil Flexi Cap Fund
Balanced / Flexi cap
NIMB Ace Capital
Nepal Investment Mega Bank
NIBL Sahabhagita Fund
Equity-oriented
NMB Capital
NMB Bank
NMB Saral Bachat Fund–E
Equity-oriented
Siddhartha Capital
Siddhartha Bank
Siddhartha Systematic Investment Scheme (SSIS)
Balanced
NIC Asia Capital
NIC Asia Bank
NIC Asia Dynamic Debt Fund, NIC Asia ELIS
Debt / Mini SIP
Laxmi Capital
Laxmi Sunrise Bank
Subha Laxmi Kosh
Equity-oriented
Nabil SIP Calculator
Nabil Invest's own Nabil SIP Calculator takes four inputs — investment period, instalment, expected annual return and years — and returns a period-by-period table of SIP amount, returns and balance. It is accurate and it publishes its formula, which is more than most.
Its limits: no step-up, no inflation adjustment, no goal mode, no tax, no chart, and a table that gets unwieldy past ten years. It defaults the amount field to "Annually," which catches people out — if you're planning a monthly SIP into NI 31 or Nabil Flexi Cap Fund, switch the dropdown first or your projection will be twelve times too small. The calculator above defaults to monthly and relabels the input as you change the cycle, precisely to avoid that error.
NIMB SIP Calculator / NIBL SIP Calculator
These are the same tool. Nepal Investment Bank merged into Nepal Investment Mega Bank, so "NIBL SIP" and "NIMB SIP" point to the same capital team and the same process — your BOID does not change because the brand name above the portal changed. The fund is NIBL Sahabhagita Fund, managed by NIMB Ace Capital.
The NIMB SIP Calculator (and therefore the NIBL SIP Calculator) mirrors the Nabil layout: investment period, annual investment, expected annual return, years. Same strengths, same gaps. If you searched for one name and landed on the other, you're in the right place — one fund, one portal, two brand names.
NMB SIP Calculator
NMB Capital's SIP runs into NMB Saral Bachat Fund–E, an equity-oriented open-ended scheme. Searches for the NMB SIP Calculator are usually really searches for the payment or login portal — a recurring pattern across all these brands, where people want the instalment page and end up on a calculator. Use the tool above for the projection; go to NMB Capital's own portal to register and pay.
SIP Return Calculator vs SIP Goal Calculator
Worth separating clearly, because people search both phrases meaning different things:
A SIP Return Calculator runs forwards. Known instalment → unknown corpus. "I can afford Rs 5,000 a month, what will I have?" That's the first tab above.
A SIP Goal Calculator runs backwards. Known target → unknown instalment. "I need Rs 40 lakh in twelve years, what must I pay?" That's the second tab.
Every Nepali bank calculator I checked offers only the first. If you have a specific target — and most people do — the second is the one you actually need.
What Nepal's Existing SIP Calculators Leave Out
I worked through the three most-visited SIP calculator pages in Nepal before building this one. Here is an honest comparison, including where they're better than me.
Feature
Nabil Invest
Siddhartha Capital
NIMB Ace
This calculator
Period-by-period table
Yes
Yes
Yes
Yes
Monthly / quarterly / annual cycles
Yes
Yes
Yes
Yes
Formula published
Yes
No
No
Yes
Direct enrolment link
Yes
Yes
Yes
No — we're not a fund manager
Live sliders (no Calculate button)
No
Partly
No
Yes
Annual step-up
No
No
No
Yes
Inflation-adjusted real value
No
No
No
Yes
Goal (reverse) mode
No
No
No
Yes
Lumpsum + SIP combined
No
No
No
Yes
SWP / withdrawal planning
No
No
No
Yes
Capital gains tax modelling
No
No
No
Yes
Exit load & expense drag
No
No
No
Yes
Visual growth chart
No
Bar split only
No
Yes
Lakh / crore formatting
No
No
No
Yes
Guidance on what rate to enter
No
No
No
Yes
To be fair to them: a fund manager's calculator exists to get you to the enrolment button, and it does that job. Siddhartha's page in particular is clean and fast. But two of the three pages carry essentially no explanatory content beyond a disclaimer — no guidance on rates, no tax treatment, no discussion of what the output means. That's the gap this page is built to fill.
Tax, Exit Load and the Charges Nobody Models
Your calculator output is a gross number. Several things stand between it and your bank account.
Capital gains tax
Under the Finance Act 2026, short-term capital gains on a holding period under 365 days are taxed at 5% for resident individuals, while long-term gains are exempt for individuals. Dividends distributed by mutual funds are subject to a distribution tax deducted at source as prescribed by current legislation.
For a SIP this creates a wrinkle worth understanding: each instalment is a separate purchase with its own holding clock. If you redeem everything in month 30, the units bought in months 19–30 are short-term and taxable at 5%; the earlier ones aren't. The tax checkbox in the calculator applies 5% to the whole gain — a deliberately conservative worst case. For a long-term SIP you'd normally leave it off.
Exit load
You can cancel a SIP at any time, but a percentage penalty applies if you exit before specified dates. Open-ended funds may charge exit fees and DP fees on redemption, with the exit fee depending on your holding period. Exact loads vary by scheme and sit in the offer document — read it before you register, not after. The exit-load slider in Advanced lets you model it.
The charges you can ignore (and the one you can't)
Open-ended SIP units are bought directly from the fund manager at NAV, so you avoid the broker commission and SEBON fee that apply to NEPSE-traded closed-end funds. Units bought directly from the manager are priced strictly at that day's NAV, with only a DP fee on purchase.
The charge you cannot ignore is the fund's own annual management expense, because it's invisible — already netted out of the NAV you see. A 1.5% annual expense on a fund averaging 12% means you experience 10.5%. Over 20 years on a Rs 5,000 SIP that difference is roughly Rs 9 lakh — Rs 49.96 lakh becomes Rs 40.88 lakh. The expense slider exists so you can see it.
What Five Years of Running a SIP in Nepal Actually Taught Me
First-hand experience
I started a SIP more or less by accident. I was building financial tooling for Nepali investors, kept telling clients that disciplined investing beats stock-picking, and eventually felt like a fraud for not doing it myself. So I registered a small monthly SIP — smaller than I could afford, which turned out to be the smartest part of the decision.
Year one was genuinely boring, and that's the point. After twelve months of Rs 3,000 instalments I'd put in Rs 36,000 and the balance was somewhere around Rs 38,000. Two thousand rupees. Meanwhile friends were posting IPO allotment screenshots. There is a real psychological cost to the early years of a SIP, and no calculator prepares you for it — the table above shows year one, but it doesn't convey how underwhelming it feels.
The NAV dropping below Rs 10 is when you find out who you are. There was a stretch where the scheme's NAV sat under par and my SIP was underwater on paper. Every instinct said stop. The one thing that kept me paying was mechanical: I'd already scheduled the payment from mobile banking, so stopping required an active decision rather than a passive one. That single piece of friction is, I'm fairly sure, the reason I'm still invested. Automate the payment. Make quitting harder than continuing.
I underestimated the payment admin, badly. Nepali SIP portals are not Netflix. E-mandates aren't universally available across schemes, instalments pile up as "pending" if you forget, and each fund manager has a different portal with a different login. I once let four instalments stack up and had to pay them in a batch. If you're starting now, set up a standing instruction or a scheduled payment in your bank app on day one — not after the first missed month.
The step-up is what I got wrong and would change. I kept the instalment flat for three years while my income roughly doubled. Running those years through the step-up tab above, that inertia cost me more than any fund selection decision ever could have. When I finally raised it, nothing dramatic happened — I just didn't notice the money leaving. Which is the whole lesson.
The dividend confusion is real. The first year a cash dividend landed, I thought that was my return. It isn't. Your total return is NAV movement plus dividends. If you take dividends as cash you're quietly disabling part of your own compounding — the reinvestment option exists for a reason, and I'd turn it on from the start.
SIP vs Fixed Deposit vs Buying NEPSE Shares Directly
SIP (mutual fund)
Fixed deposit
Direct NEPSE shares
Typical return
Variable, market-linked
≈ 2.8–5.8% p.a.
Variable, fully market-linked
Return guaranteed?
No
Yes, contractual
No
Minimum entry
Rs 1,000
Rs 10,000–25,000 typical
Rs 1,000 (100 units IPO)
Who decides what to buy
Fund manager
N/A
You
Time you must spend
Almost none
None
Substantial
Diversification
Built in
N/A
Only if you build it
Liquidity
Redeem at NAV, exit load may apply
Locked, penalty to break
T+2 via broker
Tax on gains
5% short-term; long-term exempt for individuals
Interest taxed at source
CGT deducted by broker
Emotional difficulty
Low
None
High
The honest summary: an FD is the right home for money you'll need within three years. A SIP is the right default for money you won't touch for seven or more. Direct NEPSE investing can beat both, but only if you'll genuinely do the research — and most people who think they will, don't. For readers who are also building the statutory side of their long-term savings, our guide to the Social Security Fund (SSF) in Nepal covers how that layer fits underneath a voluntary SIP.
Seven SIP Mistakes This Calculator Should Help You Avoid
Entering a return you can't defend. If you typed 18% because it made the number look nice, you didn't plan — you daydreamed. Run 6%, 10% and 15% and check whether the goal survives the low case.
Ignoring the real value figure. Rs 1 crore in 2046 will not buy what Rs 1 crore buys today. At 5% inflation it buys roughly what Rs 37 lakh buys now. Plan in today's money.
Leaving the instalment flat for a decade. The single most expensive mistake available to you, and the easiest to fix.
Stopping during a drawdown. A falling NAV means your fixed instalment buys more units. Stopping then locks in the worst of both worlds. This is rupee-cost averaging working exactly as designed — it just doesn't feel like it.
Treating the dividend as the return. NAV growth plus dividends is your return. Enable reinvestment unless you specifically need the income.
Running a SIP with no emergency fund behind it. If a medical bill forces you to redeem in month 14, you pay an exit load, possibly 5% short-term CGT, and you crystallise whatever the market happens to be doing. Build three to six months of expenses in an FD or savings account first, then start the SIP.
Picking the fund before picking the horizon. Everyone asks "which is the best SIP in Nepal?" first. The better first question is "how long until I need this money?" — that answer determines whether you want an equity, balanced or debt scheme, and the fund choice follows from it.
Frequently Asked Questions
Is this SIP calculator accurate for Nepali mutual funds?
The arithmetic is exact and matches the standard annuity-due formula that Nabil Invest, NIMB Ace Capital and Siddhartha Capital use — run the same inputs through any of them and you'll get the same figure. What no calculator can be accurate about is the return rate, because Nepali mutual funds have no fixed rate of return. The calculator is precise; the assumption you feed it is not.
What is the minimum SIP amount in Nepal?
Rs 1,000 in practice. The minimum purchase is 100 units, and mutual fund units are issued at a par value of Rs 10, which puts the floor at Rs 1,000 per instalment. Some schemes allow higher minimums, so check the specific fund's offer document.
Which is better — NIBL SIP, Nabil SIP, NMB SIP or Siddhartha SIP?
Wrong first question. Decide your horizon and risk tolerance first, then match the scheme type: equity-oriented funds for 7+ year goals, balanced or hybrid for medium horizons, debt funds for capital protection. After that, compare each scheme's dividend history, NAV trend, expense structure and exit load. Convenience matters too — if your salary account is with NMB, NMB Capital's payment flow will be less friction than a portal you'll dread logging into.
Is NIBL SIP the same as NIMB SIP?
Yes. Nepal Investment Bank merged into Nepal Investment Mega Bank, so both names refer to NIBL Sahabhagita Fund managed by NIMB Ace Capital. Your BOID and your existing SIP are unaffected by the rebrand.
Can I stop or pause my SIP?
Yes, you can cancel at any time, but an exit load may apply if you redeem before the scheme's specified holding period. Note that stopping instalments and redeeming units are two different actions — you can stop paying and leave your existing units invested, which is usually the better move if you're only facing a temporary cash squeeze.
How much tax do I pay on SIP returns in Nepal?
Under the Finance Act 2026, short-term capital gains on holdings under 365 days are taxed at 5% for resident individuals, and long-term gains are exempt for individuals. Dividends are subject to a distribution tax deducted at source. Each SIP instalment carries its own holding-period clock, so a partial redemption may be part short-term and part long-term. Tax rules change with each Finance Act — confirm current treatment with a tax professional before acting.
What's the difference between SIP and a recurring deposit?
A recurring deposit pays a contracted interest rate from a bank and your capital is safe. A SIP buys mutual fund units whose value moves with the market — no guaranteed return, meaningfully higher long-run potential, and real downside risk. There is no interest rate on a SIP. Anyone quoting you one has misunderstood the product.
Should I invest a lumpsum or start a SIP?
If the money is already sitting in your account and your horizon is long, a lumpsum mathematically wins more often, because it spends more time invested. A SIP wins on behaviour — it removes the timing decision and stops you waiting for a "better entry" that never announces itself. If you have both a lumpsum and monthly surplus, use the Lumpsum + SIP tab to model them together.
What is a step-up SIP and is it worth it?
A step-up SIP raises your instalment by a fixed percentage each year, usually to track salary growth. At 12% over 20 years, a 10% annual step-up on a Rs 5,000 starting SIP produces roughly Rs 99.4 lakh against Rs 49.96 lakh flat. You contribute more, so it isn't free — but as a way to keep your saving rate constant as income grows, it's the highest-leverage habit available to a SIP investor. Nepali portals don't automate it yet, so you raise it manually.
Why does my fund's NAV sit below Rs 10?
Rs 10 is the par value at which units are first issued, not a floor. NAV is the fund's assets minus liabilities divided by units outstanding, so it moves with the underlying portfolio. A NAV under 10 means the portfolio is currently worth less than at issue. For an ongoing SIP investor this is not automatically bad news — your fixed instalment buys more units at a lower NAV.
WS
Wilson Shrestha
Web developer and financial-tools builder based in Kathmandu. I build calculators and portfolio tooling for Nepali investors, including GoldenEdge Portfolio Manager, and I've run a SIP through a Nepali open-ended scheme since before I had any business advising anyone about it. Everything in the experience section above happened to me. Figures were verified against the published calculators and NAV disclosures of Nabil Invest, NIMB Ace Capital and Siddhartha Capital in September 2026.
Disclaimer: This calculator and article are for education and illustration only. They do not constitute investment advice, and the outputs are not predictions. Mutual funds have no fixed rate of return, unit values fluctuate with market conditions, and past dividend or NAV performance does not indicate future results. Tax rates, exit loads and scheme terms change — verify current details in the scheme's offer document and with a qualified adviser before investing. Read the prospectus carefully before investing.
Sudan Gurung Biography: From Thamel DJ to Nepal's Home Minister (2026 Update)
Last updated: 19 September 2026 • Reading time: ~12 minutes • Verified against Nepali and international news reporting
Sudan Gurung, founder of Hami Nepal, Member of Parliament from Gorkha-1 and Nepal's Minister of Home Affairs.
Sudan Gurung went from spinning records in a Thamel nightclub to running Nepal's most powerful ministry — and he did it in under twelve months. But most biographies of him online stop in April 2026, when he resigned in disgrace. They miss what happened next: the investigation that cleared him, his return to the Home Ministry on 9 June 2026, and the Bhotekoshi flood that has made him the most scrutinised minister in Balen Shah's cabinet. This is the complete, current picture.
Founding Hami Nepal; leading the 2025 Gen Z movement
Political party
Rastriya Swatantra Party (RSP), joined 18 January 2026
Constituency
Gorkha-1, House of Representatives (29,896 votes)
Current position
Minister of Home Affairs of Nepal (since 9 June 2026)
Previous term
Home Minister, 27 March – 22 April 2026 (26 days)
Beliefs
Anti-corruption, secularism, systemic reform, youth empowerment; follows no organised religion, describes his outlook as the "religion of humanity"
Who Is Sudan Gurung?
Sudan Gurung is a Nepali politician, social activist, entrepreneur and former disc jockey who currently serves as Nepal's Minister of Home Affairs. He is the founder and coordinator of Hami Nepal, a youth-led disaster relief NGO, and he became the most recognisable civilian face of the September 2025 Gen Z protests that brought down the KP Sharma Oli government.
He represents Gorkha-1 in the House of Representatives on a Rastriya Swatantra Party ticket, and he is Nepal's 27th Home Minister. What makes his story unusual is not just the speed of the rise — it is that he had no political background at all. No party youth wing, no student union, no family dynasty. He was a nightclub owner who became a volunteer, then a movement leader, then a minister, then a resignation case study, then a minister again, all within eighteen months.
The thing most articles get wrong: Many profiles of Sudan Gurung still list him as a "former" Home Minister, because they were written around his April 2026 resignation and never updated. He returned to the post on 9 June 2026 after a government-appointed committee reported that it found nothing unusual in his landholdings. He holds the office today.
Early Life, Family and Education
Gurung was born on 18 July 1987 in Chumanubri Rural Municipality, a remote northern corner of Gorkha District. His father, Dil Bahadur Gurung, is from the same region. The family was not well-off, and Gurung did not grow up there. He moved to Chitwan as a child and was raised largely by his grandparents — his grandfather, Ramsal Gurung, worked in a hotel.
That detail matters more than it looks. Being raised away from his parents, largely in boarding hostels, is something Gurung has spoken about publicly as the source of both his independence and his early hardship. He has described crying his way into resilience as a child.
He completed his School Leaving Certificate at Kalika Gurukul Secondary English Boarding School in Chitwan, then enrolled in A-Levels at Malpi International School in Kathmandu. He never finished — he dropped out in his second year. He remains, formally, a man without a degree who now heads a ministry staffed with career bureaucrats holding postgraduate qualifications. His critics use this against him. His supporters treat it as the whole point.
The Thamel Years: Call Centre, DJ Booth, Nightclub
After moving from Chitwan to Kathmandu, Gurung's first job was at a call centre. He then moved into nightlife, working as a disc jockey and building a following in Thamel under the name DJ Sudan.
In 2012, he went from employee to owner. Together with business partners considerably older than him, he opened OMG Club in Thamel. He became known for theme-based parties — a format that was still novel in Kathmandu's nightlife scene at the time. The club made him money and, crucially, it made him connections across Kathmandu's business and social elite. Some of those connections later became liabilities: reporting on his career has noted his association during this period with figures from Kathmandu's underworld, including Dinesh Adhikari, known as Chari Don.
This phase is the part of his biography that his political opponents return to most often, and it is also the part that explains the wealth he later declared. He was a successful businessman in his twenties, long before he entered public life.
The 2015 Earthquake: A Child Died in His Arms
The April 2015 earthquake killed close to 9,000 people in Nepal. For Gurung, it ended one life and started another.
"A child died in my arms; I'll never forget that moment."
— Sudan Gurung, recalling the 2015 earthquake
He has told this story many times, and it is the pivot of his public identity. In the immediate aftermath he posted an appeal for help on social media. Around 200 untrained volunteers responded. He became a fixture at Bir Hospital in Kathmandu, where he ended up coordinating roughly 1,000 volunteers — moving supplies, managing crowds, supporting doctors dealing with a flood of casualties. Volunteers under his coordination carried rice and relief materials to rural villages and pitched tents in school grounds for displaced families.
He also came out of 2015 angry. He publicly blamed government corruption and bureaucratic delay for aid not reaching people — a position he has never softened, and which became the emotional core of his politics ten years later.
Hami Nepal: What It Actually Is
In 2020, during the COVID-19 pandemic, Gurung formally registered Hami Nepal ("We Nepal") as a non-governmental organisation. The model was simple and deliberately unbureaucratic: mobilise young volunteers fast, through social media, and deliver help directly rather than through institutional channels.
Its record includes:
COVID-19 response (2020–2021): oxygen supply coordination, food and medical relief, volunteer mobilisation across Kathmandu Valley and beyond.
2021 Nepal floods: relief distribution to displaced families.
2023 Turkey–Syria earthquakes: international contribution, unusual for a Nepali grassroots NGO.
2025 Gen Z protests: drinking water, first aid, and evacuation of injured protesters to hospitals.
2026 Bhotekoshi flood: relief collection and volunteer deployment.
The organisation has drawn support from well-known Nepali figures, including ophthalmologist Dr Sanduk Ruit, and Miss Universe Nepal 2018 Manita Devkota has served as a goodwill ambassador. Hami Nepal has received awards for its COVID-19 and community relief work.
Content gap most competitors miss
Hami Nepal's relationship with Gurung's ministerial role is now itself a live controversy. During the 2026 Bhotekoshi flood, the NGO was collecting donations through a QR code while its founder was the sitting Home Minister — the same minister whose government had just warned the public against unauthorised QR codes soliciting flood relief. The QR code was withdrawn after a government warning. Critics call it a conflict of interest between a minister's office and a private NGO; his supporters argue Hami Nepal moved faster than the state did. Either way, no responsible biography of Gurung in late 2026 can leave it out.
The 2025 Gen Z Movement: How He Became the Face of It
The protests of September 2025 were triggered by the Oli government's ban on 26 social media platforms. But the ban was the spark, not the fuel. The underlying anger was about corruption, nepotism, youth unemployment and the visible wealth of political families — the "nepo kid" discourse that dominated Nepali social media through 2025.
Gurung did not start the movement. He did not call the first protest. What he did was make himself useful, then indispensable.
How his role escalated
Stage one — logistics. Hami Nepal showed up at protest sites with drinking water and first aid. Low-profile, practical, and enormously credibility-building with a crowd that distrusted every institution.
Stage two — coordination. He used TikTok, Instagram and Discord to share protest routes, timings and safety instructions across Kathmandu and other cities. Hami Nepal's Discord server later became an open forum where the selection of an interim prime minister was discussed and voted on — one of the strangest and most genuinely novel moments in modern Nepali politics.
Stage three — casualty response. On 8 September 2025, security forces moved from tear gas and water cannon to rubber bullets and, ultimately, live ammunition outside the old parliament building in Baneshwor. At least 19 people were killed and hundreds injured that day. Gurung and Hami Nepal volunteers were visibly moving the wounded to hospitals.
Stage four — negotiation. This is where he crossed from activist to power broker. He took part in negotiations involving President Ram Chandra Paudel and Army Chief Ashok Raj Sigdel, which led to former Chief Justice Sushila Karki being installed as interim prime minister, parliament being dissolved, and early elections being scheduled.
It is worth noting that his activism did not begin in September 2025. Earlier that year he had led a transparency protest at the B. P. Koirala Institute of Health Sciences in Dharan, and he had previously volunteered with civic movements including Enough Is Enough and Occupy Baluwatar.
He turned on the interim government too
A detail that complicates the hero narrative: Gurung did not stop protesting once his preferred candidate was installed. On the night of 14 September 2025 he led a protest outside the prime minister's residence demanding Sushila Karki's resignation, alleging she was expanding her cabinet without consultation. He protested again on 24 and 26 November 2025 over allegations that relatives had been appointed to political posts. Whatever else he is, he is not a reliable ally of whoever happens to be in power — including the people he helped put there.
From the Street to Parliament
In September 2025, Gurung announced he would contest the 2026 general election, and that he would do so within a party rather than as an independent — a decision he framed as strategy rather than conviction. He also warned that the elections would be obstructed if Gen Z demands were ignored.
On 18 January 2026, he joined the Rastriya Swatantra Party and filed his candidacy from Gorkha-1. He won the seat with 29,896 votes, breaking through constituency ground that had historically belonged to the Nepali Congress and the Maoists. He was sworn in as a Member of Parliament on 26 March 2026.
The following day — 27 March 2026 — Prime Minister Balen Shah appointed him Minister of Home Affairs. Three RSP figures had reportedly staked a claim to the portfolio; Gurung got it. The gap between winning a parliamentary seat and running Nepal's internal security apparatus was one day.
Home Minister: 26 Days, a Resignation, and a Return
Day one: ordering the arrest of a former prime minister
Gurung did not ease into office. On his first day, he directed police to arrest former prime minister KP Sharma Oli and former home minister Ramesh Lekhak, acting on recommendations from a commission led by former judge Gauri Bahadur Karki that had investigated the September 2025 killings. He reportedly stayed at Police Headquarters until both arrests were carried out in the early hours of the next morning.
It was the single most dramatic act by any minister in the Shah cabinet, and it defined public expectations of him: uncompromising, personally present, impatient with procedure.
The resignation — 22 April 2026
Twenty-six days later, he was out. The trigger was his own asset declaration. When ministers' property details were made public on 12 April 2026, Gurung's disclosure showed share investments running to tens of millions of rupees, 89 tolas of gold, and land across three districts. Two problems followed:
The blank loan section. His declaration left the loans field empty. He later explained in a Facebook post that he had taken a loan in 2023, documented by a written agreement dated 15 August 2023, to buy shares in companies associated with businessman Deepak Bhatta — a man under investigation for money laundering. That loan did not appear in the official filing.
The misclassified investment. He admitted that roughly Rs 2.5 million invested in Star Micro Insurance and Liberty Micro Finance had not been entered in the correct category, describing it as a classification error.
For a minister who had publicly promised to extract every rupee from the houses of the corrupt, the optics were fatal. He resigned on 22 April 2026, citing moral responsibility. He was the first minister in the new post-Gen Z political order to fall on exactly the standard he had campaigned on.
The investigation and the return — 9 June 2026
The government formed an investigation committee led by former judge Achyut Prasad Bhandari. It submitted a 45-page report to Prime Minister Shah in early June 2026. The committee compared the asset declarations Gurung filed with the Election Commission before the election against those made public after he became minister, and concluded that it found nothing unusual in his landholdings. On other assets, it reported that it was difficult to conclude they lacked identifiable sources. Notably, the report did not reach a definitive conclusion on his monetary transactions and share investments.
On 9 June 2026, President Ram Chandra Paudel administered the oath of office to Gurung as Home Minister for a second time. Sworn in alongside him — as Minister for Science, Technology and Innovation — was Mahabir Pun, the Magsaysay-winning innovator, in a pairing that the government clearly intended as a signal of technocratic credibility.
The unresolved part: The investigation report was never made public. Gurung returned to office without the document that cleared him being released. Separately, the National Human Rights Commission has recommended an investigation into Gurung himself, arguing that the September 2025 protest turned violent after he assumed leadership of it. That recommendation has not been resolved.
Sudan Gurung's Declared Assets: The Actual Numbers
Because so much of the coverage of Gurung is about money, here are the figures as published by the Office of the Prime Minister and Council of Ministers on 12 April 2026. These are declared assets under Nepal's mandatory disclosure framework — not an estimated net worth, and not a figure any website can responsibly guess at.
Category
Declared holding
Land (own name)
19 ropani 15 aana in Karkichhap, Dhankuta (approx. 1.014 hectares)
Land (father's name)
30 kattha in Bharatpur-18, Gunjanagar, Chitwan
Land (grandfather's name)
221 ropani in Chumanubri, Gorkha — jointly held, not yet partitioned
Gold
89 tolas (declared as ancestral property)
Silver
6 kilograms
Bank deposits
Approx. Rs 6.16 million (Nabil Bank, Laxmi Sunrise Bank, Sanima Bank)
Share investments
Over Rs 43.1 million in total, including listed securities worth approx. Rs 27.46 million
Company holdings
30,000 shares in Hope Holdings Pvt. Ltd.; 57,000 shares in Lagom Premium Apartments Pvt. Ltd.; 70,000 shares in Adventure Villa Pvt. Ltd.
Vehicle
MG S5 car, valued at approx. Rs 4.8 million
Gurung's own defence has been consistent: wealth earned before entering government is not a sin. RSP leaders backed him, arguing that the relevant question is whether wealth was earned through enterprise or corruption, not whether a politician is poor. His critics counter that the issue was never the wealth itself — it was the incomplete disclosure, and the identity of the businessman whose companies he had invested in.
A note from Kathmandu
Watching this unfold from inside Kathmandu, the most striking thing was not the numbers — it was how fast the mood turned. In the first week of April 2026, Gurung was the minister who had arrested a former prime minister. Two weeks later the same social media accounts that had celebrated him were dissecting his share portfolio line by line. The Gen Z movement that put him in office applied its own standard to him faster and harder than it ever applied it to the old parties. That is either the system working, or the movement eating itself, depending on who you ask over tea in Baneshwor.
The 2026 Bhotekoshi Flood: His Biggest Test
On 26 August 2026, a catastrophic flash flood swept down the Bhotekoshi river in Rasuwa, devastating the Trishuli 3A hydropower project area and surrounding districts. The scale was enormous: more than 3,000 people rescued across Rasuwa and Nuwakot in the first days, with a large number reported missing, and workers trapped inside hydropower tunnels.
As Home Minister, Gurung sits at the centre of Nepal's disaster command structure. The Government Work Division Regulations assign him responsibility for early-warning systems, national disaster management policy, and the mobilisation of the Nepal Police and Armed Police Force. What he actually did became the defining controversy of his second term.
What he did
Coordinated rescue and relief flights from Kathmandu airport in the first hours alongside the tourism minister.
Visited flood-affected Nuwakot on 30 August and issued direct instructions to rescue teams.
Travelled to the Trishuli 3A site carrying a breaker and rescue equipment, accompanied by an Indian rescue team, to help clear the barrier blocking the tunnel entrance.
Spent days at the site personally participating in tunnel search work.
Announced that the government was exploring drilling vertically from above the tunnels as an alternative route to reach trapped workers.
Was present when two workers trapped underground for nine days were rescued alive — and was filmed carrying an oxygen cylinder connected to one of them.
Why it became controversial
Disaster management experts, former officials and some affected families argued that the person responsible for coordinating the entire national response should not be inside one tunnel. The criticism sharpened when reports emerged that relief supplies were stockpiled in Trishuli while affected communities in Rasuwa went without — a coordination failure, critics argued, that a minister at his desk issuing clear instructions could have fixed. There were also discrepancies between security agencies on basic figures: personnel deployed, people rescued, people missing.
Gurung's response was characteristically blunt. He said the Disaster Response Command Centre was operating with senior officials from relevant ministries, that he was running regular online meetings to direct the response, and that he did not need to be physically at the ministry to lead.
"Rather than worrying about where I am, I would like to request that you focus on the results."
— Sudan Gurung, responding to critics, September 2026
He added that Nepal had suffered for years from leaders who ran things from a desk without understanding conditions on the ground. It is the clearest statement of his governing philosophy available — and the clearest statement of the risk it carries.
Criticism, Controversy and Open Questions
A biography that only lists achievements is a press release. Here is the honest balance sheet on Sudan Gurung as of September 2026.
The case for him
He built a genuine volunteer infrastructure over a decade, through an earthquake, a pandemic, floods, and an international disaster — before politics was ever a possibility for him.
He resigned voluntarily when his own disclosure was questioned, a standard almost no Nepali minister before him had set.
He acted on the Gen Z killings commission's recommendations within 24 hours of taking office, when the political cost of doing so was obvious.
He broke entrenched party vote banks in Gorkha-1 as a first-time candidate.
The case against him
Disclosure failures. A blank loan section and a misclassified investment in a filing made by the man responsible for enforcing anti-corruption law.
The unreleased report. He returned to office before the investigation that cleared him was made public, and the committee reached no definitive conclusion on his share dealings.
The NHRC recommendation. An unresolved human rights commission recommendation for an investigation into his role in the escalation of the September 2025 protest.
Institutional weakness. A leadership style built on personal presence does not scale. Nepal's disaster response needs functioning systems, not a minister with a breaker.
The NGO conflict. Running a donation-collecting NGO while holding the ministry that regulates disaster relief is an unresolved structural conflict, regardless of intent.
Old associations. His Thamel-era connections, including with figures linked to organised crime, have never been fully addressed publicly.
Sudan Gurung: Complete Timeline
Date
Event
18 July 1987
Born in Chumanubri, Gorkha District
Late 1990s–2000s
Raised in Chitwan by grandparents; SLC from Kalika Gurukul
Mid-2000s
Moves to Kathmandu; A-Levels at Malpi International School (incomplete); first job at a call centre
Late 2000s
Becomes known as DJ Sudan in Thamel
2012
Opens OMG Club in Thamel with partners
April 2015
Nepal earthquake; coordinates ~1,000 volunteers at Bir Hospital
2020
Founds and registers Hami Nepal during the COVID-19 pandemic
2021
Hami Nepal leads flood relief operations in Nepal
2023
Hami Nepal contributes to Turkey–Syria earthquake response
Early 2025
Leads transparency protest at B. P. Koirala Institute of Health Sciences, Dharan
8 September 2025
Gen Z protests turn deadly in Baneshwor; at least 19 killed
September 2025
Participates in negotiations leading to Sushila Karki's interim premiership
Announces he will contest the 2026 general election
Nov 2025
Further protests over alleged appointment of relatives to political posts
18 January 2026
Joins Rastriya Swatantra Party; files candidacy from Gorkha-1
March 2026
Wins Gorkha-1 with 29,896 votes
26 March 2026
Sworn in as Member of the House of Representatives
27 March 2026
Appointed Home Minister; orders arrest of KP Sharma Oli and Ramesh Lekhak
12 April 2026
Asset declaration published; controversy begins
22 April 2026
Resigns as Home Minister citing moral responsibility
5 June 2026
Bhandari committee submits 45-page report; nothing unusual found in landholdings
9 June 2026
Reappointed Home Minister; sworn in alongside Mahabir Pun
26 August 2026
Bhotekoshi flash flood devastates Rasuwa and Nuwakot
Aug–Sept 2026
Leads flood response on the ground; faces criticism over command structure
Frequently Asked Questions
Who is Sudan Gurung?
Sudan Gurung is Nepal's Minister of Home Affairs, a Member of Parliament from Gorkha-1, and the founder of the relief NGO Hami Nepal. A former Thamel DJ and nightclub owner, he became the most visible leader of the September 2025 Gen Z protests that toppled the KP Sharma Oli government.
How old is Sudan Gurung?
He is 39 years old. He was born on 18 July 1987 in Gorkha District, Nepal.
Is Sudan Gurung still the Home Minister of Nepal?
Yes. He resigned on 22 April 2026 but was reappointed on 9 June 2026 and holds the office as of September 2026. Profiles listing him as a "former" Home Minister are out of date.
Why did Sudan Gurung resign as Home Minister?
He resigned on 22 April 2026 after his published asset declaration drew scrutiny. The declaration left the loans section blank despite a 2023 loan he had taken to buy shares in companies linked to a businessman under money laundering investigation, and it misclassified around Rs 2.5 million of investments. He cited moral responsibility.
Why was he allowed to return to the cabinet?
An investigation committee led by former judge Achyut Prasad Bhandari reported that it found nothing unusual in his landholdings and could not conclude that his other property lacked identifiable sources. The report was not made public, and it did not reach a definitive conclusion on his share investments.
Which party does Sudan Gurung belong to?
The Rastriya Swatantra Party (RSP), which he joined on 18 January 2026. During the 2025 Gen Z protests he was not affiliated with any party.
Is Sudan Gurung married?
There is no verified public record of a marriage, and he has not made his personal relationships part of his public life. Claims circulating about a wife or partner are not supported by any credible source, so this article does not repeat them.
What is Sudan Gurung's net worth?
No verified net worth figure exists. What is on record is his official asset declaration of April 2026: share investments of over Rs 43.1 million, 89 tolas of gold, 6 kg of silver, roughly Rs 6.16 million in bank deposits, land in Dhankuta, and an MG S5 car. Family land is registered in his father's and grandfather's names.
What is Hami Nepal?
Hami Nepal is a youth-led, non-partisan NGO founded by Gurung in 2020 during the COVID-19 pandemic. It focuses on rapid disaster relief and volunteer mobilisation, and has operated during the pandemic, the 2021 floods, the 2023 Turkey–Syria earthquakes, the 2025 protests and the 2026 Bhotekoshi flood.
What role did he play in the Gen Z protests?
He began by supplying water and first aid to protesters through Hami Nepal, then coordinated protesters via TikTok, Instagram and a Discord server, helped evacuate the injured on 8 September 2025, and took part in negotiations with the President and the Army Chief that produced Sushila Karki's interim government and early elections.
What religion does Sudan Gurung follow?
He does not identify with any organised religion. He describes his outlook as the "religion of humanity" and is a vocal supporter of secularism in Nepali public life.
Related Nepali Biographies
Balen Shah Biography — the rapper-engineer turned mayor who now leads Nepal as Prime Minister and appointed Gurung to the Home Ministry.
Mahabir Pun Biography — the Magsaysay Award-winning innovator sworn in alongside Gurung on 9 June 2026 as Minister for Science, Technology and Innovation.
Bidya Devi Bhandari Biography — Nepal's former President, for context on the political establishment the Gen Z movement displaced.
The Bottom Line
Sudan Gurung is the clearest test case of whether Nepal's Gen Z revolution can actually govern. He arrived in office with no political training, enormous moral authority, and a disclosure form he filled out badly. He lost the job in 26 days and got it back in 48. He has since led a national disaster response from inside a tunnel, and been criticised for exactly that.
His defenders see a man who refuses to lead from a desk in a country ruined by desk-bound leaders. His critics see someone who confuses being present with being in charge, and whose own financial record fails the standard he built his politics on. Both readings are supported by the evidence. What is not in dispute is that he is, at 39, one of the two or three most consequential political figures in Nepal — and that his story is nowhere near finished.
Sources
The Kathmandu Post — reporting on Gurung's appointment, resignation, the Bhandari committee report, his reappointment, and the Bhotekoshi flood response (March–September 2026)
Creating a successful website from concept to launch is an intricate process that involves multiple stages, each critical in ensuring the final product meets business goals and user expectations. In this successful website case study, we’ll explore the step-by-step journey of building a website, offering insights and real-world examples to guide entrepreneurs, small business owners, and web developers. Understanding each phase, from initial concept to post-launch analysis, is key to navigating the complexities of website creation effectively.
📌 Key Takeaways
Understand the step-by-step process of building a successful website.
Learn from real-world examples and strategies for effective website creation.
Discover key design and development considerations for optimizing user experience.
📋 Table of Contents
15 Sections
id=”understanding-the-basics-of-website-development” class=”autoblogger-h2″ style=”font-size: 1.75rem; font-weight: 800; color: #0f172a; margin: 2.5rem 0 1.25rem 0; border-bottom: 2px solid #e2e8f0; padding-bottom: 0.5rem;”>Understanding the Basics of Website Development
Conceptualizing Your Website
Before diving into the technical aspects, it’s essential to clearly define the purpose and goals of your website. Whether you’re starting an e-commerce site, a portfolio, or a blog, understanding your target audience and the problems your website will solve is foundational. This stage involves brainstorming sessions, market research, and competitor analysis to identify unique selling points and potential gaps in the market.
Define your goals: What do you want to achieve with your website? Increased sales, brand awareness, or lead generation?
Identify your audience: Who are your ideal users? What are their needs and preferences?
Research competitors: Analyze competing websites to understand their strengths and weaknesses.
Choosing the Right Platform
Selecting the appropriate platform is crucial for the scalability and functionality of your website. Platforms like WordPress, Shopify, and Wix offer various features tailored to different needs.
Ease of use: Consider platforms that offer intuitive interfaces and comprehensive support.
Scalability: Ensure the platform can grow with your business needs.
Cost: Evaluate the pricing models of different platforms, including any additional costs for plugins or themes.
Designing for User Experience
Key Principles of UI/UX Design
User experience (UX) and user interface (UI) design are pivotal in ensuring your website is not only visually appealing but also functional and accessible. Key principles include:
Intuitive navigation: Users should easily find what they need without confusion.
Accessibility: Design with inclusivity in mind, ensuring all users, including those with disabilities, can navigate your site.
Incorporating Responsive Design
With the proliferation of mobile devices, responsive design is no longer optional. Ensure your website displays correctly on all devices and screen sizes.
Test across devices: Use [tools](https://wilson.com.np/tools/) to test your website’s responsiveness on various devices.
Optimize loading times: Faster websites improve user experience and SEO rankings.
Development and Launch Strategies
Development and Launch Strategies
Coding and Testing
Clean, efficient code is the backbone of a successful website. Utilize best practices to ensure your site functions smoothly.
Write clean code: Adhere to coding standards and practices like those outlined by [W3C Standards](https://www.w3.org/standards/).
Test thoroughly: Conduct rigorous testing to identify and rectify bugs before launch. This includes usability testing, compatibility testing, and performance testing.
SEO and Content Optimization
Search engine optimization (SEO) is crucial for driving organic traffic. Understanding [Google’s Webmaster Guidelines](https://developers.google.com/search/docs/advanced/guidelines/webmaster-guidelines) can help optimize your content effectively.
Keyword research: Identify relevant keywords and incorporate them naturally into your content.
Meta tags and descriptions: Ensure each page has unique meta tags and descriptions to improve visibility.
Marketing and Driving Traffic
Marketing and Driving Traffic
Digital Marketing Techniques
Once your website is live, it’s time to focus on marketing strategies to attract visitors.
SEO: Continuously optimize your site for search engines.
Pay-per-click (PPC) advertising: Use PPC campaigns to gain immediate visibility.
Content marketing: Create valuable content that resonates with your audience, establishing your brand as an authority in your niche.
Leveraging Social Media
Social media platforms are powerful tools for engaging with your audience and driving traffic to your website.
Engage consistently: Regular posts and interactions help maintain an active presence.
Utilize different media: Incorporate images, videos, and interactive content to attract diverse audiences.
Analyzing and Improving Website Performance
Using Analytics Tools
Post-launch, it’s vital to monitor your website’s performance to understand user behavior and identify areas for improvement.
Google Analytics: Track metrics such as bounce rate, page views, and conversion rates.
User feedback: Collect feedback directly from users to gain insights into their experiences.
Continuous Improvement Strategies
A successful website evolves over time based on performance data and user feedback.
A/B testing: Experiment with different elements to see what works best.
Iterate based on data: Implement changes based on analytics to enhance user experience and achieve business goals.
💡 Pro Tip: Regularly updating your content and design based on analytics not only improves user engagement but also boosts SEO rankings.
⚠️ Important Note: Never neglect mobile optimization. With mobile users accounting for a significant portion of web traffic, ensuring a seamless mobile experience is critical for success.
By understanding and applying these strategies, you can build and maintain a successful website that attracts visitors, meets business objectives, and delivers an exceptional user experience. Whether you’re starting from scratch or optimizing an existing site, these insights will help guide your journey from concept to launch and beyond.
Frequently Asked Questions
What are the steps to build a successful website?
Define goals, choose a platform, design for UX, develop, launch, and market.
How important is responsive design for a website?
Crucial for accessibility and user experience across devices.
What digital marketing strategies can increase website traffic?
SEO, PPC, content marketing, and social media engagement.